Saturday, September 30, 2006

Gold Charts & Commentary

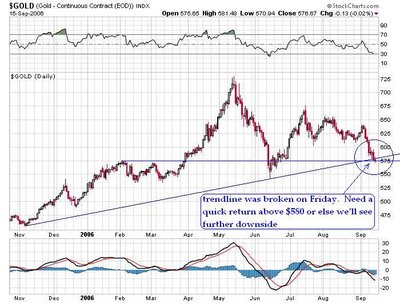
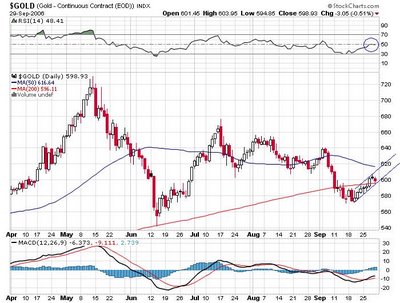
Comments: Gold has been maintaining a narrow channel up recently. RSI appears to be struggling to get above 50 (positive). The 200 simple MA may support at $596.

Comments: Viewing it from a longer time frame, Gold has some significant downtrend resistance at $615. Hopefully the weekend will bring in some Gold-positive news.

Thursday, September 28, 2006

HUI Chart & Commentary


Comments: The 320 area in the HUI looks like it could be a legitimate target for this upmove, but we'll have to see whether we can hold the short term uptrendline tomorrow.

Sentiment: Still short term bullish.

PM Portfolio Exposure: 92% + 4% short S&P500

Just to let everyone know, I'm traveling to California today until October 10th, during which time my ability to post updates here may be limited. But we'll see how it goes. In any case, feel free to drop me a note about anything precious metal related if you have any thoughts, comments or ideas.

Update on U.S. Gold Corp. (USGL)

I wrote to investor relations of U.S. Gold Corp. yesterday, questioning whether Mr. McEwen is currently properly focussed as the CEO of USGL, noting that "With shares down 55% from recent highs, I wonder whether the focus is all there when I read every other day that Mr. McEwen is leading a crusade for the share value of another company?"

I received a prompt reply in which Ms. Aguirre, the director of IR at USGL, set forth some valid reasons for the recent weakness in the share price of USGL as follows:

"To begin with, a comment in regard to our share price might be useful. As you may have noted, the price of gold dropped over the past few weeks and this affected companies across the sector. In addition, as you may remember earlier this year US Gold closed a financing for $75.15 million. As part of that financing 16 million shares at a price of $4.50 were issued that did not become tradable until about 3 weeks ago. If you look at our price history, you will see a huge increase in volume as well as a dramatic drop in share price coinciding with this. Thus the combination of these shares becoming tradable and the fluctuating gold price has affected our share price over the past few weeks. However, we are happy to say that our share price is not
due to any shift in management’s strategy or operations agenda.

As far as what we are doing to drive our share price higher, I can tell you that our two focuses, exploration and consolidation of the Cortez Trend, are still moving forward. As our exploration efforts produce results and as we move forward with the acquisitions, the share price should be positively affected."

However, Ms. Aguirre also mentioned the following recent activities of Mr. McEwen with respect to USGL:

"In regard to Rob McEwen’s current projects, he is currently at the Denver Gold Forum where he presented on behalf of US Gold to industry leaders. In addition, he is also meeting with US Gold management and US Gold directors while he is in Colorado."

In fact, its the shinenegans at the Denver Gold Forum that inspired my e-mail to IR at USGL in the first place. According to a media report, Mr. McEwen used the forum to advance his personal agenda of "trashing" Goldcorp's deal to acquire Glamis Gold Ltd. As a result, the board of directors of the Denver Gold Group may now consider suspending Mr. McEwen and U.S. Gold Corp. from the Group's activities. Considering the prestige of the Denver Gold Forum and considering that any company trading on the obscure pink sheets needs all the promotional opportunities it can get, for USGL to be suspended from the Forum would be very unfortunate, to say the least.


Related Article: "Gold Forum organizer upset with Goldcorp founder"
http://www.globeinvestor.com/servlet/story/ROC.20060927.2006-09-27T204303Z_01_N27415971_RTRIDST_0_BUSINESS-MINERALS-CONFERENCE-MCEWEN-COL/GIStory/

Wednesday, September 27, 2006

Making Sense of the HUI


Comments: What is the above chart? Can you guess? I'll give you 3 guesses. It's the upside down chart of the HUI. If you guessed it right, then you may do well on an IQ test.

Sometimes when I feel really uncertain about a chart, I turn it upside down to see whether that perspective is more helpful, and frequently it is. I think two things became more readily apparent to me when looking at the HUI chart in this way:

1. First, the HUI has recently been quite badly oversold so that a bounce is quite understandable at this point. I think this is more obvious if we look at the recent sell off upside down, i.e., like as if it was a strong rally.

2. Second, there is a fairly interesting similarity between the way this sell off has been shaping up so far compared to the way that the sell off shaped up in June. If things play themsevles out similarly, we could see a bounce back to around 320 HUI (which move would correspond to the completion of the action in the "a" rectangle in June), followed by a reversal back down towards 260 HUI, in the same way that the action in rectangle "b" played itself out in June. It will be interesting to see whether the HUI plays itself out in this way this time around as well.

Charts of Interest (RGLD, VGZ)

Comments: VGZ is struggling to regain its broken uptrend, which is currently at around $10.00. A hunch tells me that VGZ may close right at $10.00 today. VGZ was planning to spin off its Nevada properties to a new entity by around mid September. No update about the timing of the spin-off has been made however VGZ recently filed a shelf registration statement primarily in order to raise funds for the spun off entity. I'm looking forward to the spin off as it could add another quality company to the existing trading and investment options in Gold.

Comments: I think it has to be deemed a bit of a disappointment that during the recent two Gold price decreases, Royal Gold did not take advantage of depressed prices to sign any new royalty agreements to revitalize the royalty pipeline. In fact, they haven't announced any royalty deals since last December. Technically, there is still plenty of room for the already abundant short sellers to keep punishing RGLD if Gold continues to tumble.

McEwen Loses Focus?


McEwen Loses Focus?

With a chart like the above, you gotta wonder whether USGL's shareholders are really thrilled that the CEO is in the news every other day leading a crusade for the value owned by shareholders--of another company. Rather than escalating the war against the dilution of Goldcorp shareholders in connection with the GG/GLG merger, perhaps Mr. McEwen would do better to focus his attention back on his job of creating shareholder value at U.S. Gold Corp.

Tuesday, September 26, 2006

Charts of Interest (USD, S&P500)

Comments: Is the S&P 500 going to break out after all? Right now it looks like it is avoiding the bearish wedge and making new highs. Another day of this and I may have to close out my small short position. Even though it looks good, I still wouldn't totally dismiss the potential for a fakeout.


Comments: Looks like the USD Index is attempting a recovery. The 86 level is important for the short term. The pattern is a triangle with a target of + / - 3 points.

HUI Chart & Commentary


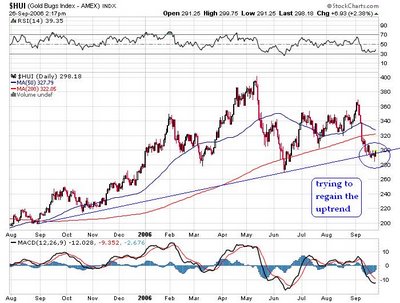
Comments: HUI is trying to regain its 1 year uptrend but it's a struggle with 300 HUI now a resistance level. A rebound to 320 HUI would be a welcome development. Whether it will happen however is the question.

Sunday, September 24, 2006

Precious Metals Wrap-up

1. Thai Coup a Gold Positive or Negative? Although it may make sense that Gold should react positively to news of a coup in progress in this rapidly developing SouthEast Asian country, it's not clear what effects it may have on gold, if any. The Associated Press reported that "Thailand's unexpected overnight military coup rattled Asian financial markets Wednesday and pressured the Thai baht and other regional currencies, though its economic repercussions remained unclear." Accordingly, if the coup leads to a weakening of Asian regional currencies, that could be dollar positive and thus actually negative for Gold. However, so far, although some minor regional currencies weakened, overall, the Dollar has been weaker recently.

2. Update on Kimber: Kimber Resources' prefeasibility study should be out any day now since they said in September. Might be worth holding on to or buying more Kimber at this time. Although the Puplava proxy action has now muddied the waters at Kimber, Pupluva IS an insider, and he wouldn't be fighting to replace management if he was aware that the study results might not be that good.

3. Bin Laden Death Rumor: A French intelligence report according to which Bin Laden died within the last month was leaked over the weekend. Although it does not appear to be credible, if it somehow turns out to be true, that could pose a speed bump to any recovery rally in Gold this coming week.

Sentiment: Cautiously Short Term Bullish

PM Portfolio Exposure: 92% + 4% S&P500 short

Profit/Loss Last Week: -7% loss (another tough week...)

Friday, September 22, 2006

USD Chart & Commentary


Comments: After reviewing the USD Chart overnight, I shifted to short term bullish on gold. A little plunge in the USD resulted in an RSI uptrend break, which has bearish implications for the USD and bullish implications for Gold. The problem is that the general market is also looking vulnerable as I previously mentioned, and that may create a headwind for Gold stocks for the time being.

Sentiment: Short Term Bullish

PM Portfolio Exposure: 92% + 4% short S&P500

Thursday, September 21, 2006

New Strategy

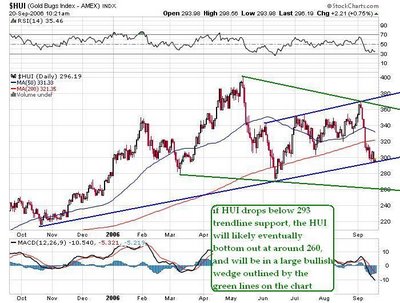
Comments: HUI has now slipped just under the 1 year trendline support. More downside is possible. The ideal place to bet on Gold stocks would be 260. I exited most of my positions yesterday after growing a bit cautious on whether we can actually sustain a bounce at the trendline. Two things are potentially working against Gold stocks at the moment: (i) a potentially bearish general equities market, and (ii) the fact that the USD may enjoy a brief rally as it is still far away from its 200 day MA and is soon approaching some downtrend resistance. I'm kind of hoping that Gold miners do roll over. 260 HUI would be the perfect set up. any lower and the Head & Shoulders would be activated--but that would be impossible on the fundamentals that are prevailing, thus a perfect long set up.


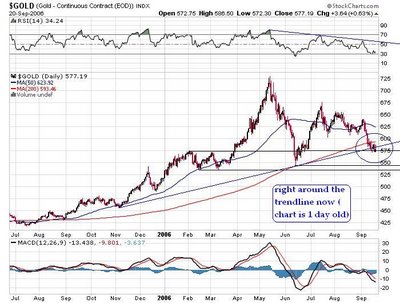
Comments: Gold is right at trendline support.


Comments: S&P500 looks like it's about to roll over. If it does that, chances are it may temporarily take the Gold miners down with it.

New Strategy: I'm going to be watching the general market more closely now. There's a decent chance that it may be rolling over here. Accordingly, a good strategy in this market would be to short the general market (S&P500/Nazdaq) when the general market is falling, and go long Gold miners when the general market is bouncing. If the breakdown develops, that may be my strategy for the coming weeks.

Sentiment: Short term uncertain, but more bearish than bullish.

Portfolio PM Exposure: Mostly out of PMS for the moment, but keeping my KBX position--Kimber is due to come out with its prefeasibility study results in September, so probably next week. Also a small position in SH, a bear ETF. I may build my position there and swing from bearish S&P500 on the market sell offs, and long Gold miners on the market bounces.

Wednesday, September 20, 2006

HUI Chart & Commentary


Comments: Obviously a lot depends today on the market's reaction to the Fed rate decision and especially the comments. The Fed will likely leave rates unchanged, which may be enough for a bounce in Gold. However, on the negative side for Gold, the Fed will also likely point to recent inflation data which has shown only mild to moderate inflation, in an attempt to convince the market that their claim of a slowing economy leading to lower inflation is right. If traders are convinced by that argument, the HUI uptrend will surely be broken either today or tomorrow (sometimes it takes a full day to process the Fed statement).

Tuesday, September 19, 2006

HUI Chart & Commentary


Comments: After yesterday's failed rally attempt, a breakdown of the 1 year trend is quite possible, which would result in another bout of selling to HUI 280-275, at least. The best that could be hoped for then in the short term would be a bounce back to the broken trendline. Overall, the action continues to be dismal. About the only silver lining that I can think of right now is that although gold broke its 1 year uptrend at $581, the Miners haven't yet broken their uptrendline, which might be viewed as a positive divergence of sorts.

Unfortunately, we can't expect Asian jewelry demand to lead Gold to new highs at this time either. Unlike September of last year when everyone had the feeling that Gold will be heading much higher, causing jewelers to accelerate their buying, now we have the opposite situation where people are suspecting that Gold's price may go lower, and are thus not in a hurry to bid prices higher. So jewelers in Asia have shown little interest in introducing a serious bid during the Asian market period since they know that the fellas working the NYMEX will just give them lower prices the next day. So it will be mostly up to New York to stem the current selling.

Comments: the USD Index remains a key question here. It could go either way and if it rallies, it will likely stick a fork in Gold for the time being. Obviously Wednesday's Fed meeting should provide a catalyst for the USD, the only issue will be in which direction.

Monday, September 18, 2006

Charts of Interest (SA, AEM, USGL, SLV, S&P500)

Comments: S&P 500 looks like it may be at very tough resistance. A bearish wedge is forming, with a negative RSI divergence, with strong lateral resistance right there as well. It's not a sure bet, but shorting the S&P500 might be a pretty decent bet. I added some SH (the new short S&P500 bear ETF) in the amount of 4% of my portfolio, to complement the 96% PM Exposure. Good risk to reward on this trade. In fact, I can't help but wonder if I just caught the very top of the 3 year US Equities bull right here with this short.


Comments: SLV, the Silver ETF, is bouncing from 1 year trendline support. Target might be $12, which was the beginning of a gap on the weekly chart.


Comments: Looks like USGL is trying to bounce as suggested a few days ago. Target may be $5.50 to $6.00, where USGL would fill a recent gap down.


Comments: Despite VGZ's nice 6% rise today, VGZ still needs to get back above $9.80 to regain the broken uptrendline. Wonder when they're planning to spin off those Nevada properties. If you know the time table for that, leave a comment below. Thanks.


Comments: SA still strong. 1 Year uptrend alive and well judging by today's spectacular 9.26% rise.

Want me to put up a chart of a precious or base metal company? Contact me by writing a comment below or by e-mail.

Gold & HUI Chart & Commentary

Comments: Getting back above $580 spot Gold was critical today, as that was the 1-year uptrendline. that was briefly broken yesterday. It certainly helped that the U.S. trade deficit for the second quarter was the second highest on record, coming in at $218.4 bil, bringing the U.S. within striking range of beating last year's record breaking annual trade deficit of $791.5 bil.

Related Article: "Trade Deficit Up to $218.4B in 2nd" Qtr.http://biz.yahoo.com/ap/060918/economy.html?.v=4


Comments: The HUI is trying to get a much needed bounce from the 1 year uptrendline. How far can it go?

Portfolio PM Exposure: 96% (4% in SH, Short S&P500 ETF) + Calls on NEM, AEM, and GFI

Sentiment: Short Term Bullish; finally a relief rally...

Sunday, September 17, 2006

Precious Metals Market Wrap-up

1. Commodity Selling Getting Overdone? The CRB Index has definitely broken its multi-year uptrend. But the selling appears to be getting overdone with the Index's plunge becoming steeper and steeper. The question is, will we get a pause or a real relief rally?


2. Asian Jewelry Demand Key: Regarding the gold market, a key issue remains whether Asian physical/jewelry demand will resurface. There has been some anecdotal evidence of fresh buying in South East Asia and India. India and China remain keys for Gold to find some support. So far, despite anecdotal evidence of fresh physical buying coming out late last week, there just hasn't been enough demand to stem the tide of selling.


3. Cash Costs Up 10% to $306/oz. According to precious metals consultant GFMS, gold mining cash costs rose 10% in the first half of 2006, to a weighted average of $306, due to increased energy, labor and mine consumable costs.

4. The Yogi Berra of Gold: I don't know what to make of conspiracy theorist Bill Murphy and his over the top tirades against the Anti-Gold Cartel, but I am certain that Murphy is definitely the Yogi Berra of Gold. Bill came out with his latest Murphyism while commenting on last week's steep sell off in gold:

"The only solace on a day such as this is that if you are watching CNBC, or listening to other Planet Wall Street apologists, you have no clue as to what is really happening here."

Apparently, not having a clue as to what is really happening is a source of solace according to Murphy.

5. Visit to the Local Jeweller. I stopped by the local jeweler here in Seoul on Saturday and inquired about purchasing some gold bullion. They are selling and buying ingots of 37.5 grams of 99.9% pure gold at a fairly reasonable 5.26% buy-sell spread (in comparison, Kitco.com's spread is 5.87% for 1oz Gold Eagle and 2.71% for 1oz bar).

Saturday, September 16, 2006

Gold Stocks: Medium Term Outlook Bearish


Comments: A doji finish to the week on the daily HUI chart creates a 50/50 possibility of a weak bounce next week. I wouldn't get my hopes up too high however. A finish on a hammer candlestick would have been a much more promising ending. There was some support at 298 HUI in January, February and March of this year, but it would be a difficult to expect that this would now reemerge as a major source of support now.


Comments: The weekly HUI chart is bearish for the intermediate term with the break of the 1.5 year RSI uptrend foreshadowing an imminent break of the uptrend. 260 HUI looks like a likely target after the break occurs, which would then create the possibility of a very large bullish (falling) wedge to end the intermediate term bear market.

Sentiment: Medium Term Bearish.

Current PM Portfolio Exposure: 90%; been buying into the weakness in hopes of a bounce...

Gain/Loss for the Week: -11.73% (at this rate, I might as well be thinking in terms of a 30 year retirement plan, rather than a 3 year...)

Thursday, September 14, 2006

GG Overpaying for GLG?

Eric Probstfield sent me the following thoughts after reading my comments regarding the GG/GLG merger and since he brought up some good points I thought I'd post them here and open them up for discussion.
  1. What do you think after reading Eric's comments? Do you think that GG will be overpaying for GLG?
  2. What do you think would have been a fair premium for the proposed transaction?
Let me know your opinion after reading Eric's comments by clicking the comments link below.
"I read your analysis, and you make some good points on your blog site. But I'd like to know your opinion on why this merger is a good idea now that we're using a ratio of 1.6 to 1 in favor of GLG when we (GG shareholders) voted down a merger with GLG a couple of years back with a ratio of 1.1 to 1, before we merged with Wheaton River. According to this, that would mean that the Wheaton River acquisition had a significant negative asset value. I am not aware of a significant change in the ratio of proven and probable resources between GG and GLG (except for the significant addition of resources in the WHT acquisition) during this time frame.I just don't get how we voted this merger down a couple of years ago, and now Tefler supposedly has so much support that only two shareholders disagreed? Something here just isn't passing the smell test. Well, I guess including me, take the total dissenters to 3.Can you help me understand how my logic is flawed?

I've been a long-time holder of GG, and have to confess, although the items that you point out are true, IMO, I don't think it justifies giving that much of a premium to GLG, especially considering the points above. I think GG can get to the same point by buying some much more reasonably valued juniors that are struggling due to poor management but have good assets, and they can do that without basically giving away almost 1/2 the company. We're paying a premium for the good mgmt in place at Glamis, and I don't understand why we want to do that when GG's management doesn't need any bolstering (or so I thought). We want cheap assets, especially any that we can utilize existing infrastructure that we have or another potential takeover target owns. I'd like to see the response and debate that would hopefully stir up if you posted this to your blog. I'd really like to hear some opinions that challenge the logic here, because so far I haven't heard any
."
As an addendum, it was announced today that IAG will acquire CBJ for a 31% premium in a stock swap transaction, which premium is just a little less than the original premium in the proposed GG/GLG merger.


HUI Chart & Commentary

Comments: The Chart just looks sick. There is no end in sight to the selling and unclear whether there are any supports until HUI goes lower. The interesting thing is that the USD Index hasn't gone anywhere recently, but gold still continues selling. In a sense, it's like last year when Gold decoupled around September from the USD Index, only this time that decoupling has meant that Gold falls while USD stays roughly the same. The crazy thing about today's crazy $20 sell off in Gold is that the USD Index also was marginally lower.

Wednesday, September 13, 2006

HUI Chart & Commentary

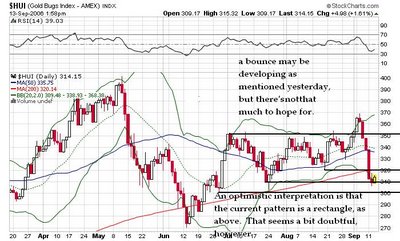
Comments: A bounce may be developing as anticipated. A price target may be 320 for a bounce, though it could conceivably go higher or simply fail. The above chart considers the possibility that the current pattern is a less bearish rectangle rather than a failed ascending triangle, however, that seems a bit unlikely.

Chart of Interest (USGL)

Comments: USGL has been horrible lately, with a reverse parabolic arc heading increasingly down in an accelerating spiral that seems unsustainable. $4.50 may prove to be short term support here with a potentially large if quick bounce developing from here. The strange thing is that there really hasn't been any news recently that would explain the selling (other than the drop in gold).

Update on Kimber (KBX)

I contacted Kimber investor relations yesterday regarding the recent announcement about the disagreement with Mr. Puplava. Although the person who replied to my inquiry indicated that they were not able to get into the details of the dispute, I did learn the following interesting information:

1. The disagreement concerns how the Company “has been” or “should be” managed (as is quite typical of such disagreements).

2. With respect to the timing of the resolution of the dispute, I was informed that "assuming the Proxy battle moves forward each side will be presenting their position and shareholders will likely vote on it at the AGM in early December. Information would be distributed in the Proxy statements in November." Accordingly, it may yet be quite a while until we get to hear about the reasons for the dispute.

3. Interestingly, I was also informed that "Management also has some disagreements and issues with Mr. Puplava, but I cannot go into specifics at this time."

I will be providing updates about this matter on my blog, to the extent that I am able to uncover any new information.

Tuesday, September 12, 2006

HUI Chart & Commentary


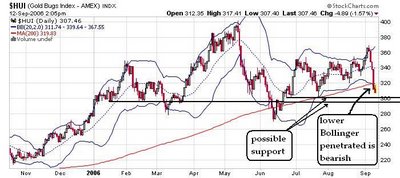
Comments: Gold and Gold stocks continue falling. But some support may be found soon around the HUI 300 area. The selling generally seems like it's starting to get a bit overdone. Today featured the highest reported monthly trade deficit on record ($68 bil.) along with a (failed) terror attack on the U.S. embassy in Syria. It's hard to imagine Gold dropping too much lower with this kind of news in the background.

The key bearish factors at the moment are:

  • A dearth of physical/jewelry demand, especially in Asia
  • dovish noises coming from Iran, and
  • a suspected minor technical upside breakout in the USD

The first issue may require lower prices to resolve, but the other two could potentially be reversed at any time. I would look to play a bounce as we approach the 300 HUI area. A bounce, if it develops, could go as high as 320 HUI, but, in my opinion, not higher.

Sentiment: bearish but expecting a bounce shortly

Portfolio PM Exposure: 66%.

Monday, September 11, 2006

HUI Chart & Commentary

Comments: Like a hot knife through butter, the selling in the HUI has taken out the uptrend support without even a pause. At this point, the most likely scenario will be for the HUI to spend some time--possibly even a few months--below the 200 day MA. Not the most pleasant of prospects, to be sure. This will create a more challening environment for swing traders in the gold sector, but not an impossible one.

Saturday, September 09, 2006

HUI Chart & Commentary

(click to enlarge)


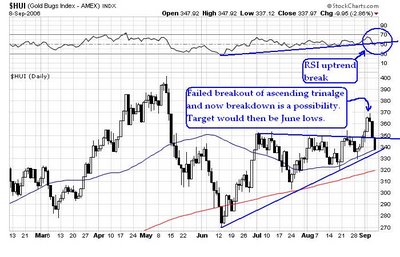
Comments: What seemed like it might be a retest of the breakout turned instead into an ugly failed breakout with the reversal coming on heavy volume. Although the HUI is still within its uptrend, its RSI uptrend has been broken. Likewise, the XAU broke down out of its triangle on a gap down (the HUI does not show gaps). Volume was generally heavy, which is also not an encouraging sign. Spot Gold is right at its $610 triangle support. Any lower and that will also be a breakdown on that chart as well. Although a bounce early next week may be possible, my guess is would be a bounce that you may want to sell into rather than buy.

Reasons for the Breakdown: The main reason is that gold stock traders got ahead of themselves expecting the usual season September rally in gold. Such rally generally occurs due to physical/jewelry demand around this time. However, there has been no evidence thus far, that there is anything more than spotty physical demand at Gold over $600. The fact that the Iran crisis has coincided with the commencement of the period of stronger jewelry demand may also have hurt gold as it is likely that jewelers may have been reluctant to buy with the Gold price expected to be volatile due to geopolitical tensions.

Does this mean that gold cannot sustain a price over $600? I don't think so. Gold can and will march higher. It is important to note however that we are currently in a demand replacement cycle where physical/jewelry demand for Gold is replaced by investment/currency hedging demand. Until recently, around 80% of Gold demand was related to the jewelry demand. More recently, demand has begun to be increasingly driven by investment demand relating to currency and geopolitical instability. However, such demand is not yet high enough (like it was in the late 1970s) to consistenyly be able to drive the Gold price higher.

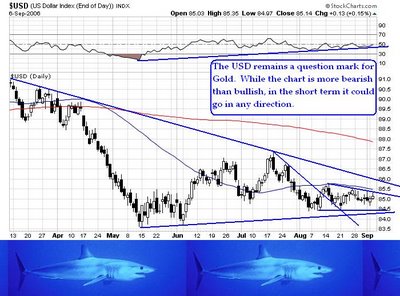
The other reason for the ugly reversal is that the USD Index, after trading sideways for a while, has shown some indication that it wants to rally (a patriotic rally going into September 11?). The fundamentals seem lousy for a Dollar rally, so I'm not expecting it to go too far. However, it may well go far enough that it deals a painful blow in the short run to Gold and Gold stocks.

Current PM Portfolio Exposure: 91%

Sentiment: bearish--looking for appropriate exit and expecting an imminent breakdown in the HUI and Gold

Portfolio Gain/Loss for the Week: -4.8%

Thursday, September 07, 2006

Charts of Interest (LIHRY, SPM.V, $USD)


(click to enlarge)

Comments: Please see my comments in the charts above.

GG/GLG Merger -- The Birth of a Golden Goliath

(click to enlarge)

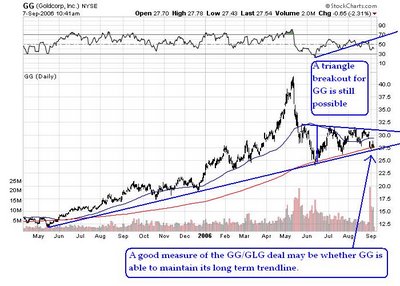
GG/GLG Merger. The recently announced merger between two of the most exciting larger cap gold companies should be beneficial to all the parties involved and give a nice boost to the industry as a whole. Although it does entail a setback for recent swing traders in GG who have been howling into the night about the 32% premium involved, while awarding swing traders who had the luck of recently buying GLG with a windfall, the merged vehicle ("NewCo") should be the most attractive option out of the 3 largest cap gold stocks (ABX and NEM being the other two) and present an excellent option for both investors and short term traders in the gold sector.

1. NewCo will have by far the lowest cash costs out of the three.

2. NewCo will be unhedged, unlike ABX.

3. NewCo will have a growing reserve base, unlike NEM.

4. NewCo's larger market cap will be attractive to institutional investors, including to funds that are significantly larger than the relatively small precious metal funds. This is why former GG CEO Robert McEwen's is unlikely to find much institutional shareholder support for his wild idea of trying to arrange for a vote on the deal on the GG side.

5. The addition of the GLG reserves will increase the proportion of Gold and Silver assets to base metal assets (let's face it--a more appropriate name for the old GG would have been Gold and Copper Corp., but that just didn't have the same cachet), which should allow NewCo to attract a higher valuation since pure precious metal plays generally enjoy higher valuations than base metal stocks.

6. Not only may NewCo become the most liquid gold stock, it may also challenge NEM as the most liquid option play, which will be a boon for gold stock option traders who are generally faced with a paucity of option liquidity beyond a small handful of names.

7. Finally, NewCo will undoubtedly overtake both ABX and NEM to become the largest capitalization gold stock after about 6 to 12 months following the merger. That is probably the reason why Robert McEwen, who has shown a keen interest and vision for gold empire building, has recently been boiling with jealousy.

Plenty to look forward to, both for investors and swing traders as far as New Co is concerned.

HUI Chart & Commentary


(click to enlarge)

Comments: A retrace back to the breakout point often provides a great opportunity for an entry/reentry. Today we are seeing just that, and while there is no guarantee that the HUI will not fall back below its breakout, generally speaking, I consider this to be a pretty decent probability time to go long. That's what I did, loading up with the cash that I had as well as reloading on the calls. Good luck to everyone.

Wednesday, September 06, 2006

Chart of Interest (TRE)

Comments: TRE looking a little scary with that giant head and shoulders top pattern looming large. Now with a possible pullback in Gold, TRE will need to hold on to that trendline. It seems that with the current breakout in place in the Amex Gold Bugs Index (HUI) however, a break down from the Head & Shoulders is unlikely and TRE may be a good pick up here. High volume recently indicates a possible seller washout.

Tuesday, September 05, 2006

Why the Surge in the Miners?

It's obvious that we have a technical breakout in the Amex Gold Bugs Index from the triangle pattern. What is less clear is why the index is breaking out.

The Iran situation is one possible reason, but Oil has been falling during the Iran crisis so why would Gold rise?

The other plausible reason is physical buying since September is a period of seasonal strength. However I have not read anything to inidcate that strong physical buying is behind the current surge.

Of course there are otrher reasons that may account for the rise in Gold, for instance the fact that the Fed, in all likelihood, has not only paused but ended rate hikes.

Throwing some further fuel to the speculation is the fact that the inflation reports in the last couple of weeks were not as grim as originally feared (though still elevated), lending a slither of credibility to the Fed's suggestion that inflation may lessen with the slowing of the economy. But if the economy is really slowing, then why is Silver, more an industrial metal, outperforming Gold?

What then is causing this breakout in the miners and will Gold follow? I think we'll soon get a better feel for what the current action is about. In the meantime, with the miners looking a little overbought it's probably better to take some profits and watch a little bit and see how the action develops without being too leveraged. I would likely look to commit my remaining capital at around 355 HUI.

HUI and Gold Charts & Commentary


(click to enlarge)

Comments: After a period of prolonged low volatility, a big move appears to be in progress. The Amex Gold Bugs Index (HUI) has now definitely broken out, touching as high as 366. Gold is testing its downtrend at around $636. With the HUI penetrating deep into the upper Bollinger, it appears to be oversold in the short term, though some further gains can't be entirely discounted.

I sold off some calls in NEM and GLG for some nifty profits today--they were all September and October expirations so too leveraged not to take some quick profits. I also rejuggled my trading portfolio, eliminating PAL and VGZ which appear to be getting very over bought (VGZ appears to be going parabolic) while adding LIHRY on the breakout past $48.00 and doubling down on TRE and adding a small USGL position.

TRE remains a mystery with its continuing underperformance and today's sell off on very heavy volume. It seems some people still believe it is overbought after its recent spectacular runup which saw it gain over 900% in less than a year. For a company with no revenues, that is a large gain. Still, I believe at some point the buyers should show up.

On one hand, the gold stocks are generally overbought in the short term. On the other hand, it is not impossible that they could still go to further overbought. Accordingly, I think my current 60% exposure is appropriate, with the rest ready for reentry in case we get a pullback.

Current PM Portfolio Exposure: 60% + a handful of TRE Calls.
Sentiment: Bullish but will wait for a pause before adding any more.

Sunday, September 03, 2006

Charts of Interest (PAL, NTO, LIHRY, RGLD)


(click to enlarge)

Comments: Please see my comments by clicking on the charts above. I like LIHRY the most out of the 4 above. PAL should see $8.50 soon. NTO is fine, but it may be stuck between two ascending trendlines unless it can clear $4.75 next week. RGLD looks like it has formidable resistance up above. Let me know your comments.

Saturday, September 02, 2006

Kimber Resources, Inc. (KBX)

(click to enlarge)

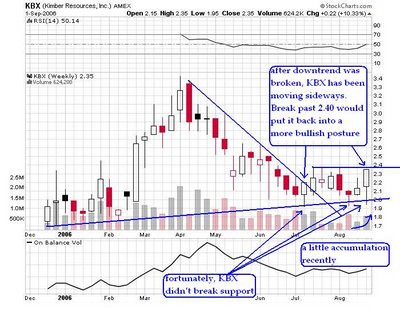
Comments: So what's been up with KBX? After a thrilling start following its Amex listing, KBX has been in the crapper since the sell off in Gold in April. Even after Gold recovered during the last few weeks, KBX has continued to trade listlessly sideways on decreased volume, retesting support and testing the patience of its investors severely.

The following issues may have played a role in suppressing Kimber's share price recently:

1. The decision to delay the Prefeasibility study until September in order to complete further drilling work on the Carmen deposit.

2. Recently announced delays in maximizing drilling capacity at the Carotare deposit and the El Orito Norte target due to insufficient road access to the drilling sites.

3. Uncertainty due to continuing political unrest as a result of the contested results of the recent Presidential elections in Mexico.

4. Recent significant insider selling by major investor and Kimber Director Jim Pupluva which may have raised some doubt about the outlook for Kimber.

Despite the above, there is a possibility that September could be a good month for Kimber. Not only are gold and silver starting to perk up heading into September, Kimber's crucial pre-feasibility study for the Carmen deposit is also due out in September, which will give a glimpse at the potential economics of an open pit mine at Carmen.

While the pre-feasibility study is being prepared, the other key to Kimber's success will be the drilling at the Carotare deposit and the El Orito Norte target. Carmen is only 500 meters in length, with Carotare and El Orito Norte adding another 2.5 kilometers to what Kimber speculates will prove to be a continous 3km zone of gold and silver mineralization. Thus, drilling at these two other targets will be critical for Kimber to add additoinal ounces.

I understand that Kimber is currently working on building proper road access to the relevant parts of the drill targets by drilling, blasting and compressing the hard rock that has unfortunately been discovered at these two locations. Mr. Darren Klinck, Vice President, Corporate & Investor Relations, sent me an e-mail on August 21, 2006, in response to my question about the delay, stating that, "We have been drilling and blasting for the past two months and have recently added additional compressors. One drill is now turning on Carotare,with the goal to get two drills running full time at Carotare and El Orito next month [i.e., September]". He added that,"to be clear this is our #1 priority behind delivering the Pre-Feasibility study. We recognize that this is where the greatest chance lies to add ounces and we are moving quickly in this regard."

In the best case scenario, this month would bring promising results from the pre-feasibility study in addition to further positive drilling updates from the Carotare deposit and the El Orito Norte target, all with the backdrop of rising gold and silver prices. Such results would hopefully cause Kimber's share price and trading volume to pick again and bring back some of the excitement Kimber's shareholders enjoyed at the beginning of the year.
COT Report


Comments: Current Commercial net short positions is one of the lowest in 12 months. This may be conducive to a fall rally.

Friday, September 01, 2006

Charts of Interest (TRE / FCX / EGO / SLW)


(click to enlarge)

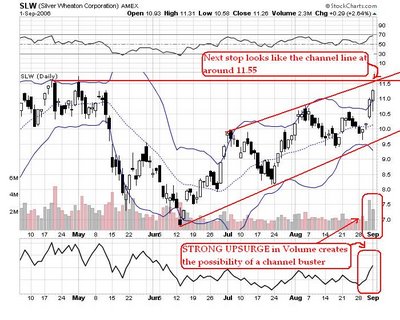
Comments: Please see my comments by clicking on the above charts. If you have any comments or would like me to put up the chart of any precious or base metal stocks, you can e-mail me (titan_of_metals@yahoo.com) or submit your comment below with your request. Love to get comments!